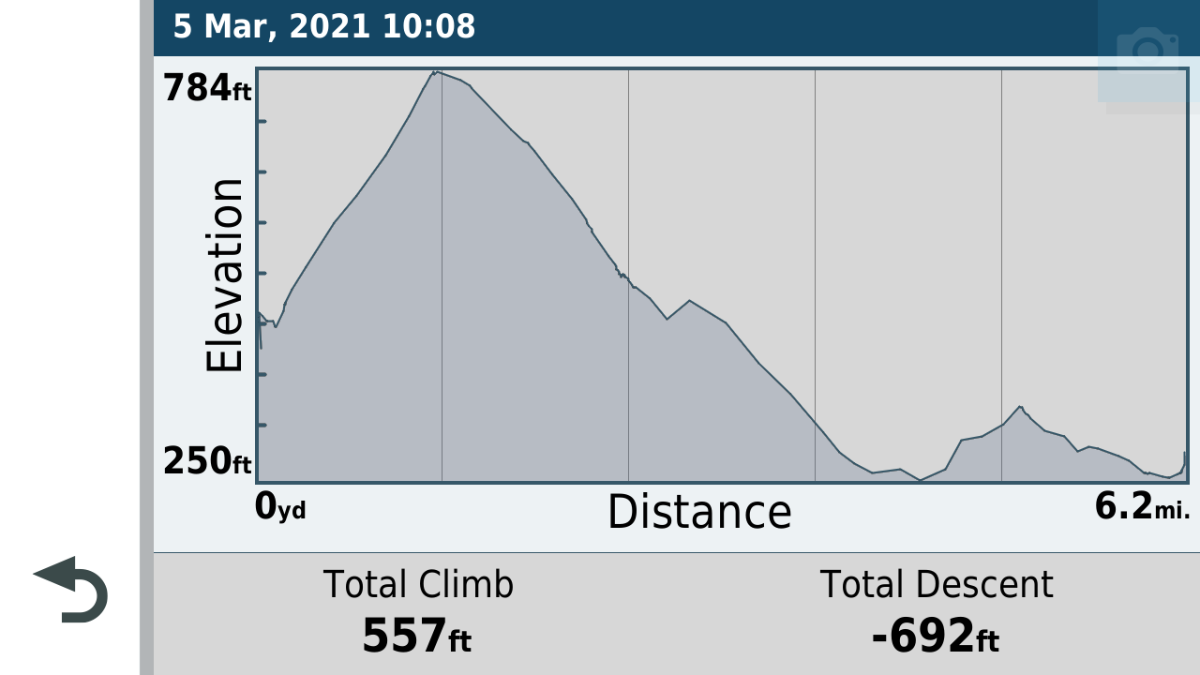
You can get an elevation profile by loading the tracks app - as in your picture, click the track icon in the top left corner and on the right hand side you have two tabs - top one represents tracks you have recorded with the app, the bottom one gives access to the tracks that are always being recorded - these are listed by date, and there may be a few for the same date. Click on one of them, and it shows the track on the map. Click the spanner, top left corner and there is an option to show the elevation profile.
Like this.

- 18330.png (111.76 KiB) Viewed 3765 times
However, a better bet is to use Basecamp. I don't know how much experience you have with it, but when you connect a PC to the XT with a USB cable, you can see the contents of your XTs memory, lower pane, left hand side. I don't know where the recorded tracks are shown - I guess they will appear in the same window, but the always-being-recorded Active Logs are in there.
Click on the appropriate date, and the track shows up on the map - Labelled Active Log with a date and a time.
Click on that and the track will appear on the map. Probably in grey.
Zoom in on the map to see it more clearly. Each of the little dots represents a position, speed and elevation reading.
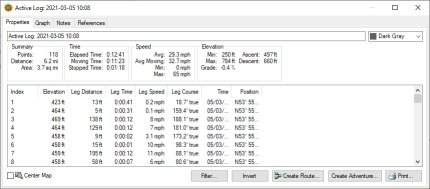
Double click the track - either on the map or by its name in the lower left hand window of Basecamp, and you get a table which looks like this

- BC Track Data.jpg (18.57 KiB) Viewed 3765 times
Which gives you elevation, time, speed, course, date, position. You can select this and copy the entire table to paste into a spreadhseet if you are so inclined. (Click on a row in the table, CTRL-A to select all, CTRL-C to copy to the clipboard).
Or double click on a row, and the map will zoom into that point to show you where you were doing 187mph.
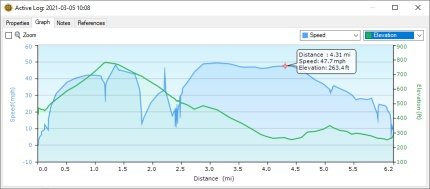
At the top, there is a tab - Graph.
Click that tab and it will give a speed or elevation profile. You can choose which one from the frist drop down list on the right. You can add the other to the same graph by choosing it from the second drop down list.
Like this

- Combined Speed & Elevation.jpg (15.41 KiB) Viewed 3765 times
As you move the mouse along the line of either graph, a little figure is plotted onto the Basecamp map, to show you exactly where you were on the map at that point on the graph.
All very interesting stuff. Note - as pointed out above - the speeds are the snapshot figures obtained fromt he satellite. All data from the satllite is prone to errors, and it usually takes a few reading and a complex average calculation in order to be able to get a reasonable value. The graph smooths these figures out, but if you plottted the data in the GPX file, it would be very spikey. It is impossible for anyone to use that data and say that at this particular point you were travelling at 187mph. However, they can say with very good accuracy that your speed between these two points was 163mph. You may have noticed that when you accelerate, the speed indicated on the satnav lags behind your bike speedo ? It needs the extra data to work it out.
For anyone that has MemoryMap software - the gpx log files load directly into there and you can do the same sort of things using maps such as Ordnance Survey.